

Thoughts on Bullet Run-Out & Small Sample Sizes
feature By: Rick Moritz | October, 26
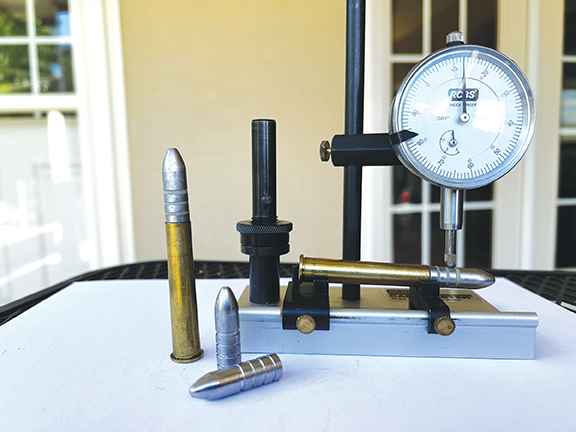
Pulling one of the 38-50 Remington Hepburn cartridges from the box, I noticed something odd as I slowly turned it between my fingers. It appeared the bullet was not aligned with the cartridge case. I thought, “Right, you can see the cartridge has run-out with the unaided eye when you need glasses to read.” I put on my readers and focused on the distance between the end of the case and the nearest lube groove. They were not parallel. I thought, “You have this nifty tool that measures bullet run-out; perhaps you should use that?” Bullet run-out is affected by cartridge case neck variance, bullet concentricity, sizing, and seating die concentricity. I only had six loaded rifle cartridges, and to my utter amazement, the run-out ranged from 0.009 to 0.024 inches, with an average of 0.013 inches. I was embarrassed, and I was the only one who knew until now. I am fairly certain that my bench rifle, my ammo and I are not ready for the 200-yard Group Challenge.
Perhaps this is a good opportunity to determine whether there’s a measurable difference between high-quality ammunition with minimal run-out and the previously mentioned poor ammunition. I could certainly load some additional ammunition with very small run-out, but are six cartridges of each load sufficient to achieve a statistically significant result? Maybe.
These three “accuracy” comparisons require very different approaches.
Mr. Frank E. Grubbs, Ph.D., worked at the Ballistic Research Laboratory while he was a Captain in the U.S. Army. He wrote Statistical Measures of Accuracy for Rifleman and Missile Engineers as part of his military work. The work was privately published, but copies are available online. Geoffrey Kolbe, Ph.D., a physicist, has done shooters a great service by clarifying and distilling Grubbs’ work. I mention these two scientists because they directly bear on the first accuracy comparison mentioned above. To be 90 percent confident that we could estimate the average 10-shot group size for a given rifle, we would need to fire 10, 10-shot groups. Yes, 100 shots. In my opinion, that is the most difficult accuracy test to complete.
The second test, which compares two different loads, could be completed with as few as 30 shots per load. It is also recommended to use the Radial Standard Deviation method. This is what shooters also call the average of the string measurement, or the mean radius method. In short, the distance from each bullet hole in the target to the group’s center is measured. Every shot is used in the analysis, not just the two widest shots. The center of the group is found by averaging the distance from a vertical line drawn through the furthest left bullet hole and the horizontal distance to all the other bullet holes.
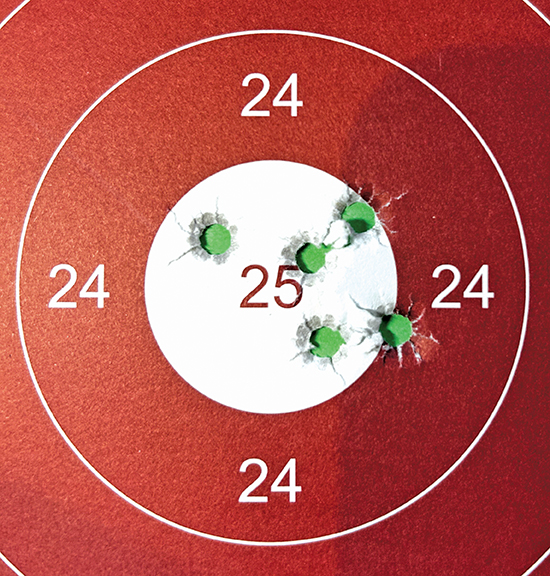
The distances for each shot are used in the statistical analysis to determine whether there is a true difference between the loads. This is my preferred method for comparing loads. It requires a minimum of 60 shots but yields very good results. In historical match results, string measurements were taken to the target’s center because they were shooting at a mark. An average string measurement of one inch or less was considered very good for a string of shots in historical matches (the total string measurement divided by the number of shots).
Using the two widest shots in a group is less efficient than the mean radius method because only two shots determine the group’s total radius. Although the mean radius method takes longer to calculate, I prefer it for testing my black powder cartridge ammunition.
The third case directly applies to the 38-50 ammo that was mentioned earlier. I have six cartridges with significant run-out and six that I recently loaded with very low run-out. In statistics, a sample size of 30 or more is considered large, while anything less is regarded as small. When a sample size is small, statistical calculations differ from those for large sample sizes to account for increased error and reduced reliability. Therefore, there must be a fairly large difference between the two samples (i.e., the two groups of six cartridges each) to demonstrate a statistically significant difference. For these small sample sizes, I used the Student’s t-test. The Student’s t-test was developed by William Sealy Gosset, an English statistician and chemist who worked for the Guinness brewery in Dublin, Ireland. He published his statistical work under the pseudonym “Student,” hence the name for the methodology. His employer wouldn’t allow employees to use their real names to protect trade secrets. What a great life Mr. Gosset must have had—working for a brewery and studying statistics on the side. It just doesn’t get any better!
Even the renowned shooter and barrel maker H.M. Pope was concerned about the appropriate number of shots in a group. Pope chastised F.W. Mann, the author of The Bullet’s Flight, for shooting only five-shot groups. In response, Mann wrote to Pope, “One of your criticisms of my book about five-shot groups does not hold if you can realize that I was not looking for small groups, but for large ones.” Mann does have a point, although I would prefer to think it is better to shoot small groups. In Mann’s defense, he was looking for the errors that caused large groups.
LOAD DETAILS
All loads used Hornady brass, 58 grains of 1½ Fg Swiss powder, CCI Large Pistol primers, and a 0.090-inch polyethylene over-powder wad. The bullet is from a custom Schauf mould and weighs 335 grains when cast from a 20:1 alloy. Neck tension was 0.001 inches. I carefully checked and cleaned my seating die and confirmed seating depth and overall cartridge length. This produced very straight ammunition; run-out ranged from 0.001 to 0.002 inches, with an average of 0.0013 inches. As previously mentioned, the less-straight ammo ranged from 0.009 to 0.024 inches, averaging 0.013 inches, an order of magnitude difference. I feel that accuracy begins to decline after about 0.003 inches of total run-out. I do not have proof for this cutoff point; it is only my gut feeling.
TESTING
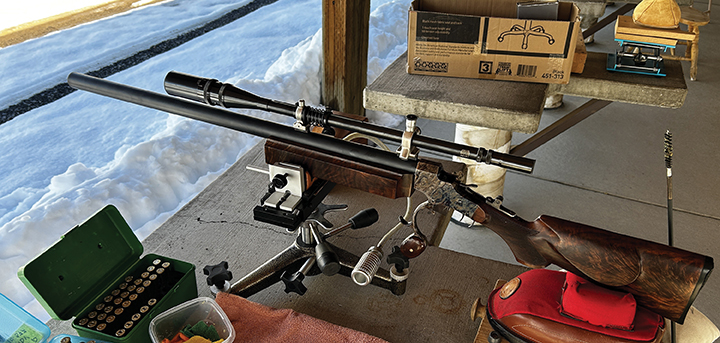
During the firing of the two sets of cartridges, there was a nearly imperceptible wind of less than two miles per hour, with humidity in the 40-50 percent range and temperatures in the mid-50s F. There was snow on the ground, but it was retreating quickly. Pretty ideal conditions for testing black powder ammunition. Two wet microfiber patches were used to clean the barrel between shots, and the chamber was swabbed with a mop to remove any residual moisture. Each six-shot group was fired in sequence. I did put out a wind flag during testing, but the flag showed little interest in the proceedings. A front rest matching the width of the rifle forend and a rear sand-filled rest were used during bench rest testing.
RESULTS
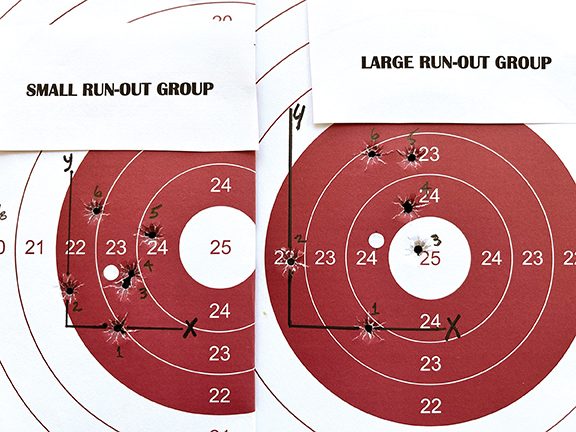
Both targets are shown; the white dot within each group is the group center, calculated as the average of the horizontal and vertical distances. The mean radius was then determined by measuring from the group center to the center of each bullet hole. The six shots fired from the large run-out ammo had a string measurement of 7.9 inches, or an average distance of 1.3 inches from the group center. The low run-out ammo resulted in a string measurement of 4.6 inches, with an average distance from the group center of 0.8 inches. There was a visible difference between the two groups. But was there enough difference to confidently state that one group of ammo was better than the other?
ANALYSIS
Using the Student’s t-test as the method of analysis, I can state with 95 percent confidence that the low run-out ammo was more accurate (Microsoft Excel-Data Analysis). Notably, the six-shot group sizes were 2 1/8 inches versus 3 3/16 inches. The small-group average string measurement was 61 percent of the large-group average. This large difference is necessary to achieve 95 percent confidence with such a small sample size. Determining whether one lot of ammo is better than another when groups are very close in size will always require more shots, typically more than 30.
DISCUSSION
I plan to shoot additional witnessed groups at 200 yards that are worthy of submission to the BPCN for the 10-shot challenge. Maybe I will start with a not-so-small 10-shot group and then work my way down. If I have any success, I will share the details right here. S
BIBLIOGRAPHY
Kelver, Gerald O. ed. Respectively yours H.M. Pope Fort Collins, Colorado. Robinson Press, Inc. 1976
geoffrey-kolbe.com/articles/rimfire_accuracy/group_statistics.htm
Grubbs, Frank E. Statistical Measures of Accuracy for Riflemen And Missile Engineers.1991