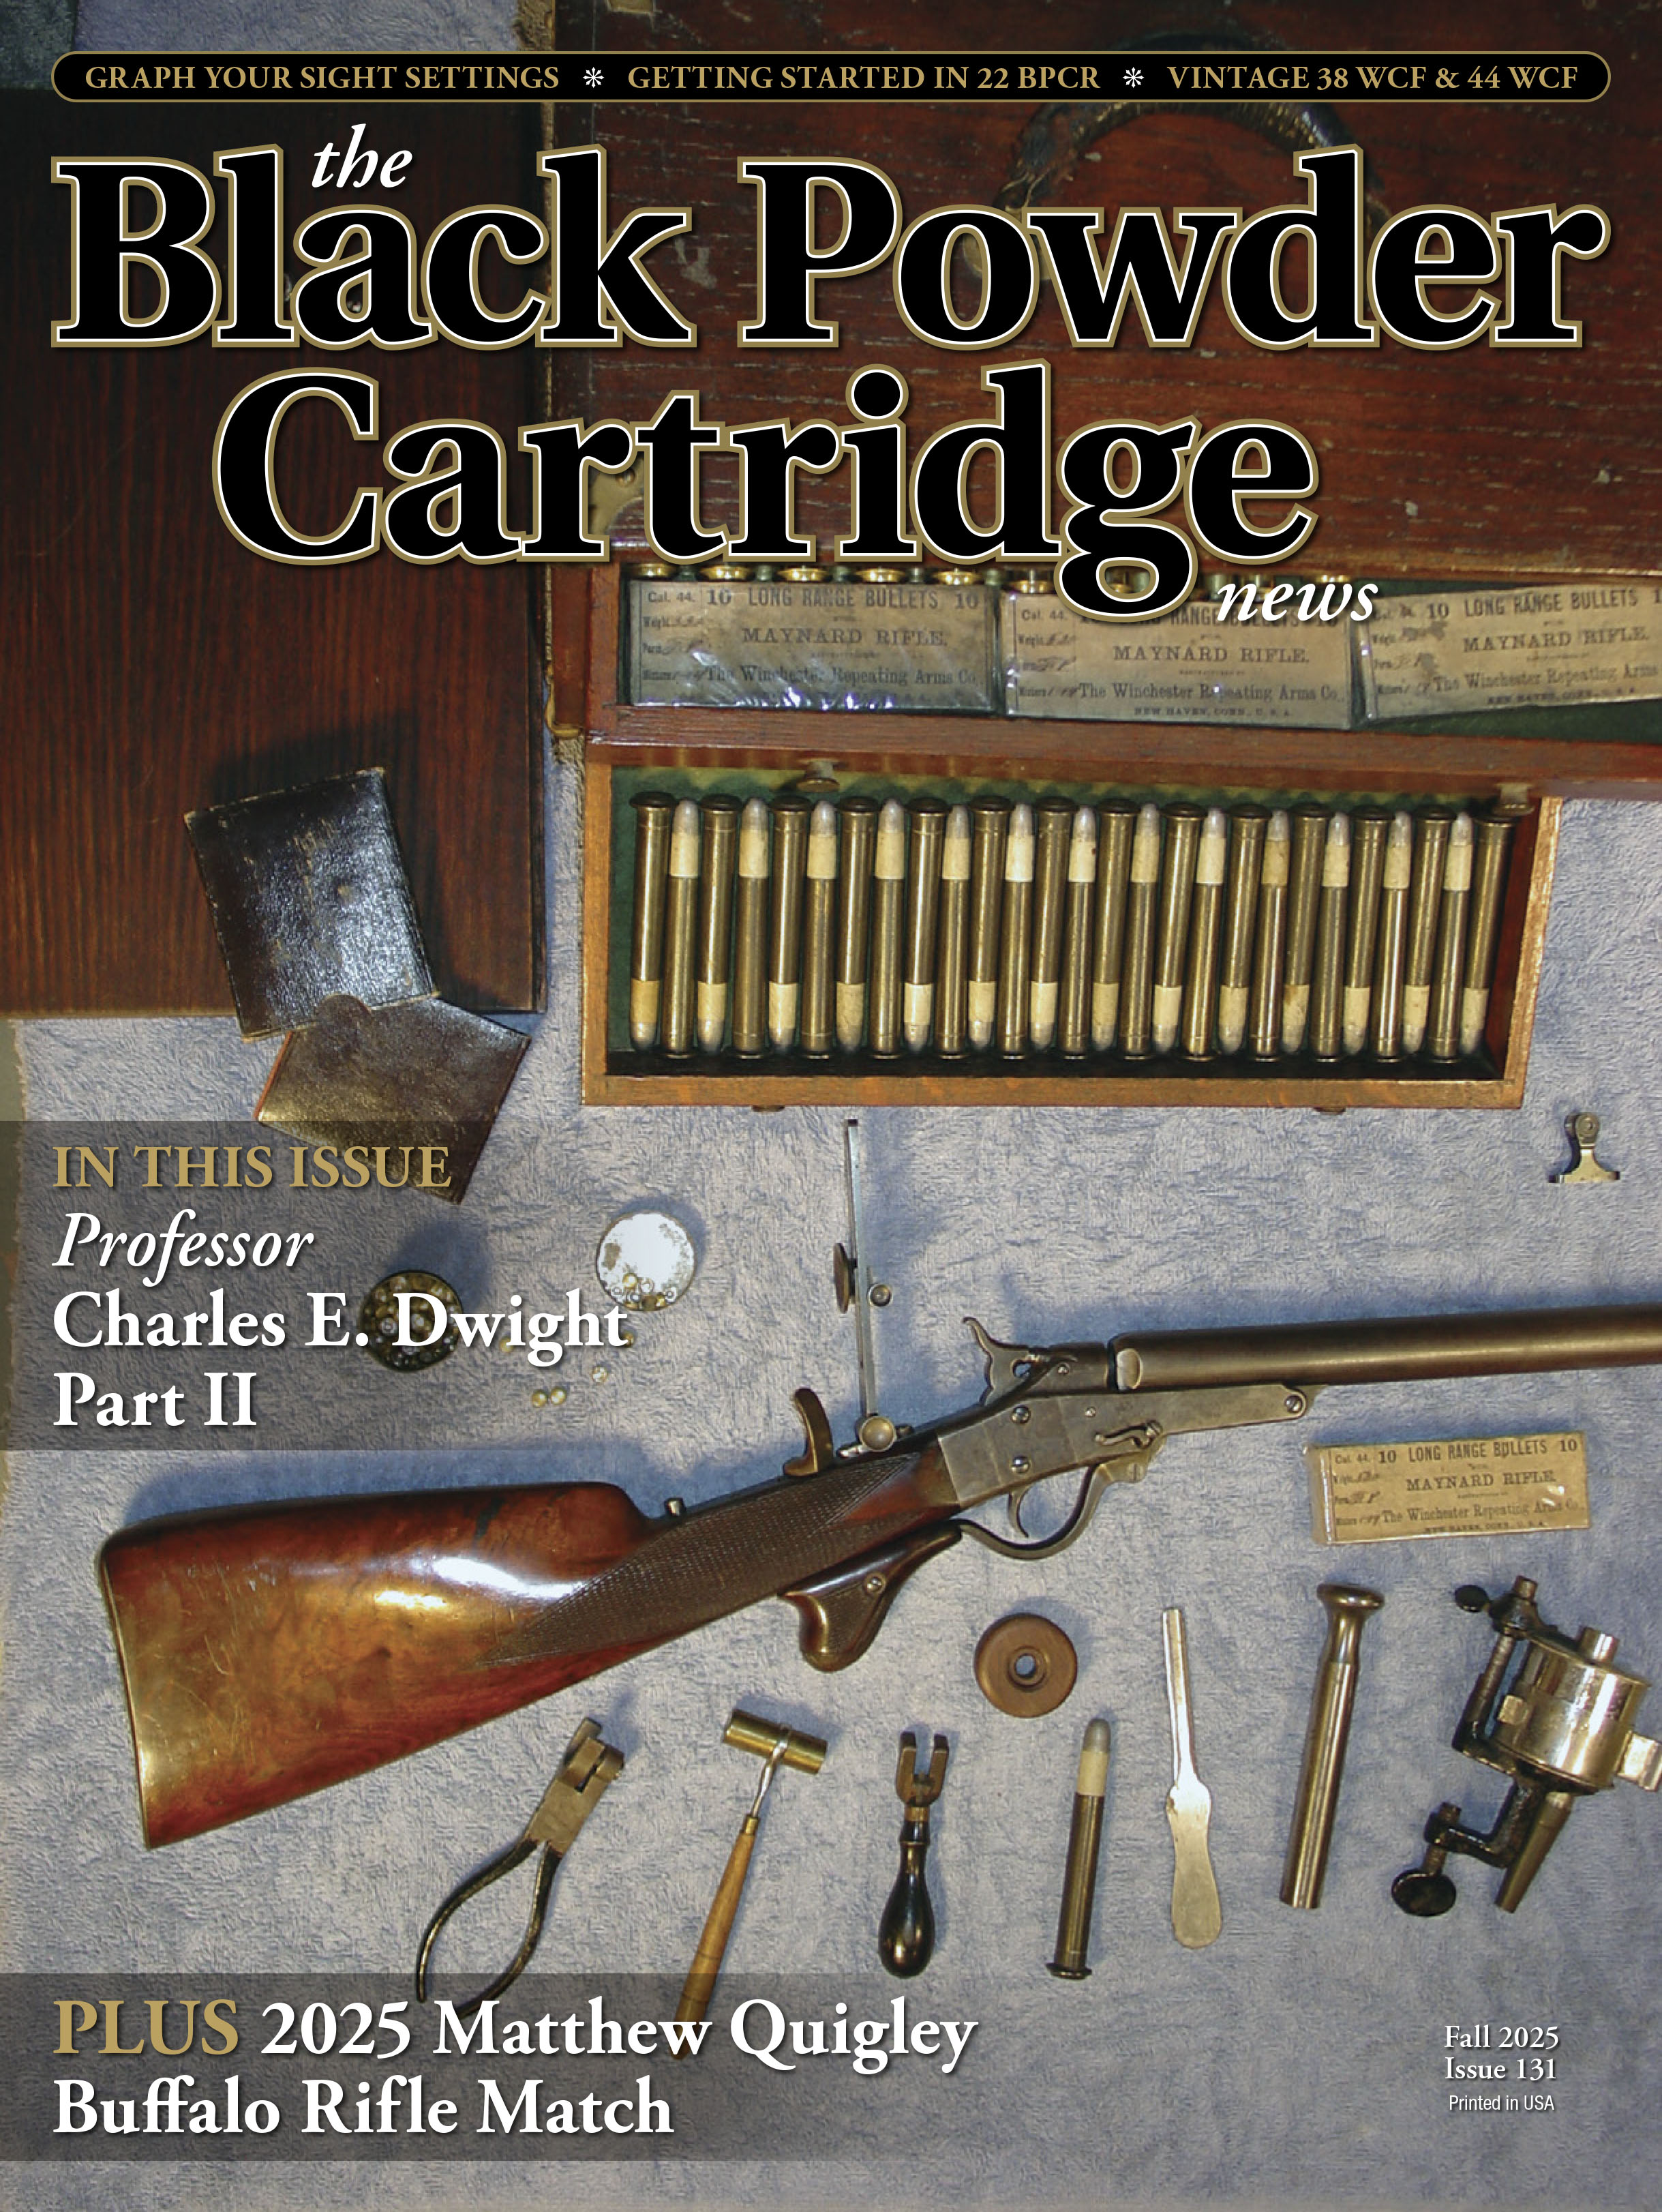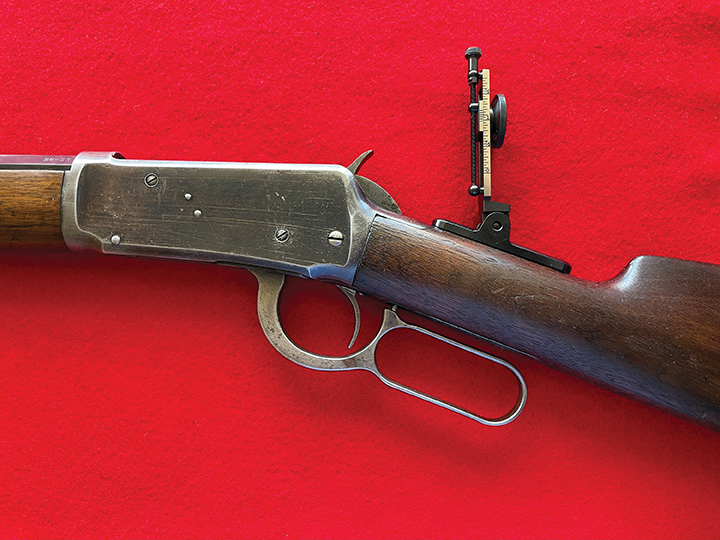
This article is about using a graph with your vernier tang sight to quickly get on target at any practical distance. Shown here is an MVA mid-range sight on a Winchester Model 1894 in 38-55.
How do you determine the rear vernier sight setting for a distance that you have never shot at before? In other words, how do you find a setting for a distance that is not already listed in your shooting notebook? For short ranges, you can walk the bullet impacts up from the bottom of the paper target until you get into the black. At longer ranges, most of us use a lot of valuable ammo looking for bullet impacts in the dirt, moving the sight up incrementally until we get on target. However, it is very aggravating if you can’t see the splashes because the dirt is wet, covered with grass, or you don’t have a spotter. Additionally, some ranges don’t even have berms at all the various distances to show the impacts. Or, how about if all of your settings are in yards, as established at your home range, and then you go to a BPCR silhouette range that is in meters? Steel gong matches at unusual distances are yet another challenge that eats up a lot of ammo just to get on target.
In this article, I will show you an old-fashioned, easy way to get on target quickly without wasting ammo. In the 1970s, I learned this trick from a very old shooter from the Schuetzen era (whose name I don’t recall) and later from a fellow named Bill Ballard in the 1980s. However, I have never seen an article about this subject, so here we go. There is also a modern use for this trick that these two fellows would never have dreamed of, which is using a laser range finder to first get the distance, and then using your paper graph to get a quick sight setting for that specific distance. Obviously, this is very handy to get in the ballpark when shooting at an unknown distance, plinking in the boonies or shooting at varmints.
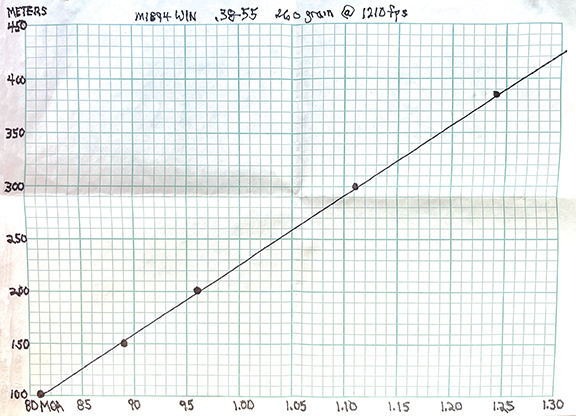
This is the graph for the lever-action 1894 Winchester in 38-55. It will get you on paper, or on steel, using the least amount of ammo and with a minimal amount of hassle. This graph is in meters, but you can also use yards, or both.
All you need for this trick is a piece of graph paper as shown in the photo. I put the distance to the target on the left vertical axis, and I put the vernier scale Minute of Angle (MOA) numbers along the bottom horizontal axis. In the lower left corner is the shortest practical distance that I want to shoot, and in the upper left corner is the furthest distance that I foresee shooting with that particular rifle. As an aid to understanding, let’s use the graph that I recently made for an old Winchester Model 1894 in 38-55. It has a Montana Vintage Arms midrange tang sight with a globe front sight. The barrel is 26 inches long and the velocity is 1,210 feet per second (fps) with a .380-inch, 260-grain 1:20 alloy bullet. The results were obtained from the benchrest position on a perfectly flat range with little wind. Looking at the graph, you will see that the 100-meter sight setting is a dot at 81 MOA, the 150-meter setting is a dot at 89, the 200-meter is 96, the 300-meter is 1.11, and at 385-meters the dot is at 1.24. If you draw a line through these points from the lower left to the upper right, you can use this graph to select sight settings for any distance in-between any two known points. For example, a target at 250 meters would be 1.04 MOA. Likewise, you can follow the line beyond 385 meters to get a much longer range estimate. Here you see that the sight setting for a 420-meter target would be 1.30.
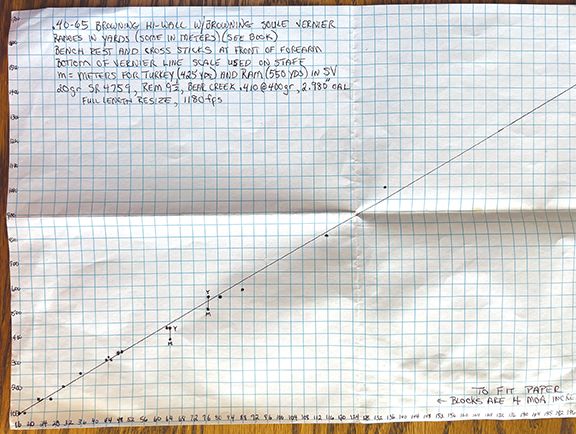
Here is a graph for a Browning High Wall in 40-65 with sight settings out to 1000-yards. For this one the line is also straight, or almost so, as it should be. Sight setting dots above or below the line are usually due to shooting uphill, downhill, or in the wind. For this graph, each small quarter-inch square along the bottom edge is four MOA, instead of the previous one MOA, in order to get the maximum range possible on this one piece of paper. You just use a smaller dot to get a one MOA increment inside the small square.
What’s that you say? “
The line should not be straight! It should be curved like the trajectory of the bullet.” That is a logical assumption, but the curvature is accounted for by the growing difference between your sight settings as the range increases. At longer ranges, it takes many more minutes of elevation to get on target than at shorter ranges. Just look at the jump between the settings for 300 and 385-meters. To further illustrate this straight, or nearly straight line, please see the photo of the graph for my 40-65, which I have shot out to 1000-yards and beyond. This graph was actually used to get the settings for the longer ranges, to include the 580, 800, and 1000-yard distances. Variations slightly above or below the line were attributed to shooting uphill or downhill, different shooting positions, the wind, and other atmospheric conditions. I am sure that a computer could come up with a firing solution for each distance, but it would also be thrown off by the variables just mentioned above. Besides, who wants to mess with a computer when all you really need is one piece of graph paper in your pocket? With the paper, you can set your sight quickly before your computer even warms up, and before you can remember how to navigate that darn ballistic app.
If you have several different handloads for the same gun, you can plot them all on the same graph. See the photo of my 38-55 High Wall graph that I used while stationed in Europe for the annual BPCR European Championships that were shot from 50-300 meters, and called the “Match Belge Sharps.” No spotters were allowed and the berms were usually wet, so I had to rely on this graph for bullet placement, and it worked perfectly to win some trophies. The dashed line is a light black-powder handload at 1,040 fps, the solid black line is for a similar black-powder load at 1,227 fps, and the red line is a smokeless hunting load at 1,428 fps. All three loads used the same 300-grain bullet.
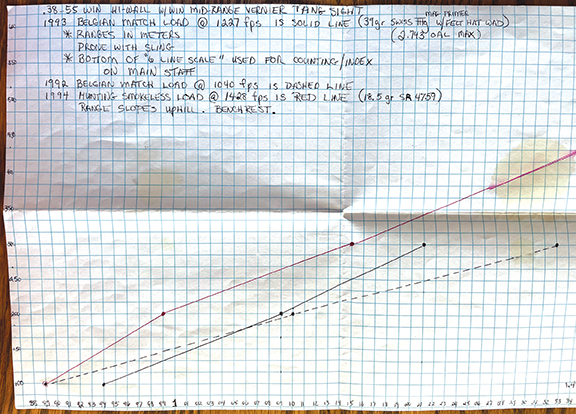
More than one handload for each gun can be plotted on one piece of paper. This graph is for a Winchester 38-55 High Wall, showing two different black powder target loads, and one hot smokeless load for hunting (in red).
I suppose you could even use some old Redfield, Lyman, or Anschutz receiver sights in this manner since they are MOA capable, but I have never tried that. Likewise, some antique or cheap tang sights have very crude scales, but I bet you could come up with some sort of graph nevertheless.
Yet another use (or actually a reverse use) for this graph is for when you are out in the boonies shooting at unknown distances and you don’t have your laser rangefinder. This is often the case when plinking with your buddies at rocks on the sides of distant hills as a form of friendly competition. Once you get your sight setting by walking the bullets into the target by observing the impacts in the dirt, you can consult your graph to determine the distance. This gives you better bragging rights so you can recount the “extreme” distance for that impossible shot!
The old man that taught me all of this was born in the late 1880s, and his entire gun collection consisted of four high-quality antique single shots that were his pride and joy. In fact, looking at his guns was the first time I ever saw a Pope Schuetzen or Sharps Long Range rifle. It seems that he had been an expert shot and gunsmith in his youth. He lived alone in a very humble cottage in the panhandle of Florida, and he kept the rifles stored inside a foldout couch that made into a bed. He figured that no burglar would ever look in there. He had no relatives, and I learned that after he died, all of his possessions and furniture were simply hauled to the dump. I have often wondered…did anyone bother to look inside that old, torn couch?